Projected balance sheets
The GDD platform provides a continuous rolling short-term outlook for the global dairy market.
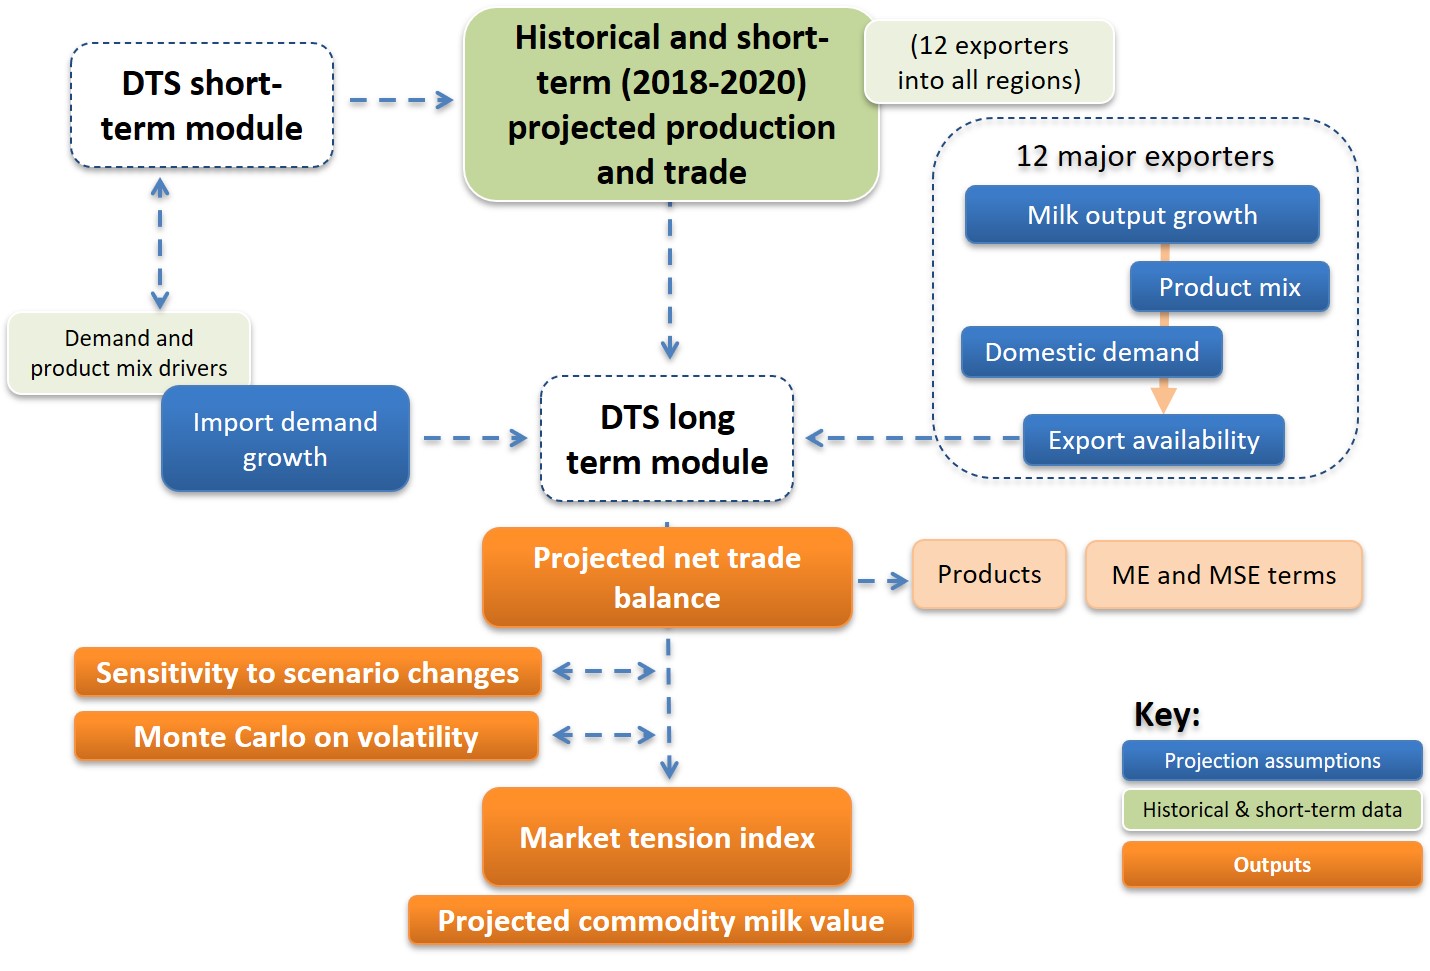
The DTS is built on a platform of historical supply chain data in balance sheet format that reconciles milk production and dairy product production and use for the 12 major dairy producing exporters – EU-27, US, UK, New Zealand, Australia, Argentina, Belarus, Uruguay, Brazil, Ukraine, Turkey, Canada, and India.
The short-term projections in the DTS are based on assumptions affecting the balance sheets of each major exporting producer, in terms of:
- Milk production growth;
- Product mix – the use of milk in major product groups;
- Domestic consumption – affecting the volumes of product available to trade; and
- Exports based on shares of import demand from external markets.
This analysis is updated monthly as new historical data (and revisions) becomes available and as fresh intel informs the forward assumptions.

Value series
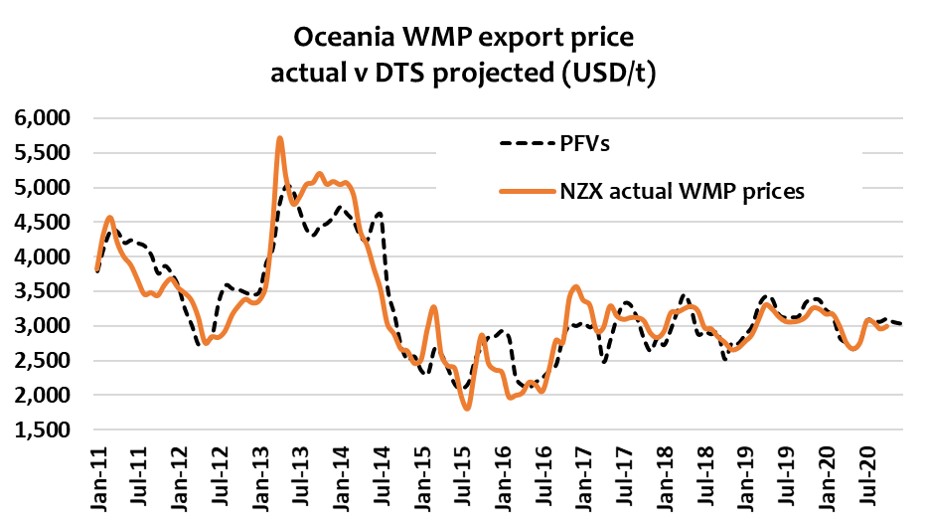
The platform derives Projected Fundamenta Values (PFVs) as a proxy for monthly forward price projections. PFVs are developed for each of a number of highly visible, long-running spot price series that dairy market participants are most familiar with.
These are sourced from:
- United States: CME spot quotes; USDA weekly dairy market news reported prices; and USDA NDPSR;
- EU-27: EU Commission weekly observed prices and major country wholesale market quotes; and
- New Zealand: NZX weekly spot quotes and Dairy Australia monthly spot prices.
Daily or weekly spot price quotes are averaged into monthly observations in our workings.

Projected fundamental values (PFVs)
We derive monthly PFVs using econometric multiple regressions.
Separate forward projection equations are developed from regression analyses for each of the product value series across the major exporting regions (as above) based on historically available information for relevant supply and demand factors (independent variables) sourced from publicly-available data sources and own estimates.
In each of these cases, we identify independent variables that provide correlations that explain close to or better than 90% of historical price movements over a statistically valid period.
Historical data and forward assumptions are revised monthly. We also review each regression monthly to ensure the relationships remain significant and properly reflect the market reality. Where necessary, we revise the projection formulae and variables if influences have altered due to the impact of any supply and demand factors.
The DTS is constructed such that changes in assumptions affecting supply and demand projections will also alter the PFVs, ensuring a dynamic analysis of the potential risk or opportunity.

Measures
We have developed a number of measures in the analysis that aid to the interpretation of the effects of change over time.
Milk solids equivalent (MSE) is used to represent overall volumes of demand (including global exports) and supply, based on butterfat and protein typically used in dairy products according to common specification.
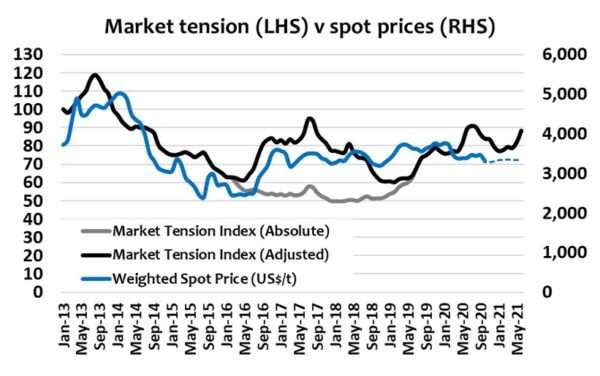
Market tension has been derived from estimated movements in historical and projected stocks of commodity milk powders in the hands of major exporters and is expressed as an index (the Market Tension Index or MTI). MTI movements are the inverse of trends in the estimated commodity powders (SMP and WMP) stocks. The higher the index, the greater the tension and shorter the supply of milk. When stocks are high, the tension index is low. The rationale for this is that the level of any surplus or shortage in milk availability will show up in changes in volumes of powder stocks.

